Eubrewnet Wiki
Eubrewnet Documentation
Eubrewnet Documentation
The Vienna Convention for the Protection of the Ozone Layer and the subsequent Montreal Protocol on Substances that Deplete the Ozone Layer have been among the most successful environmental agreements the nations of the world have entered into and have now almost completely eliminated the production of human-made “Ozone Depleting Substances”. This has led to the halting of the rapid decline of ozone observed in the 1980s and 1990s, with some promising early indications of ozone recovery now being apparent. It is therefore important to continue to carefully measure the state of the global ozone layer into the coming decades, noting also that stratospheric conditions are expected to change with the projected increasing concentration of greenhouse gases, and the fact that stratospheric ozone itself has a significant effect on the atmospheric radiation balance and surface climate. For this reason, the Vienna Convention obliges signatory countries to maintain programs to systematically monitor stratospheric ozone. The Brewer Ozone Spectrophotometer has, for the last 30 years, been the instrument of choice for ground station measurements of ozone and, in an effort to significantly improve the quality and timeliness of the data, COST Action ES1207 was initiated to form a European Brewer Network – EUBREWNET.
EUBREWNET now recognised by the WMO and IO3C, It represents an extremely valuable grid of ground station data points without which the space-borne instruments would not be able to function with any degree of accuracy. In the current times when we are trying to identify ozone recovery rates of 1% per decade it is highly important that data is both accurate and consistent across all stations. The purpose of EUBREWNET is to harmonise observations, data processing, calibrations and operating procedures so that a measurement at one station is entirely consistent with measurements at all the others. Additionally, the Brewer also measures spectral UV irradiance, sulphur dioxide and aerosol optical depth. Some are also able to measure nitrogen dioxide. A harmonised Brewer network includes the largest harmonised ground based UV network in the world, available for assimilation into the satellite models to greatly improve accuracy of the satellite data and forecasting. Another important point is the link to climate change where tropospheric ozone and aerosols are still regarded as having the largest effect on uncertainties in climate models. The Brewer measures total column ozone which includes both tropospheric and stratospheric ozone whereas satellites struggle with the lower altitudes. I think it should now be clear how the Brewer and EUBREWNET, and the expertise that goes with them, are essential components of a more holistic investigation of the problems we face in our atmospheric environment, rather than just routine ozone measurements.
The actual implementation can be summarised:
Eubrewnet system is a Data Storage and Scientific Information Processing system for the Brewer spectrophotometers (Brewer et al., 1973) operating in different European stations. Currently it also includes Brewer spectrophotometers operating in Asia, Africa, Australia and South America (http://eubrewnet.aemet.es/eubrewnet/brewer/index). Data from all the participating instruments are sent to the Eubrewnet database several times per day, processed in almost real time and products of different confidence levels are generated.
The database system consists of a number of subsystems or components of varying complexity, which interact and perform tasks such as:
Interaction between the users and the database is achieved through the Eubrewnet website (http://eubrewnet.aemet.es/eubrewnet/default/index). The website of COST1207 can be used as an additional tool for the users. It provides information for events and activities relative to Eubrewnet network. Additionally it provides links to the Eubrewenet forum where all registered users can post their comments and questions and the owncloud, which can be used to upload documents and data and exchange information.
All the above processes are performed by one or more components, which are implemented using variable technologies and open source free software. It is always possible to extend the systems by own development.
In Figure 1 there is a simplified diagram of the Eubrewnet system. The system works using Hypertext Transfer Protocol (HTTP)(https://en.wikipedia.org/wiki/Hypertext_Transfer_Protocol), the outer layer of which is a HTTP proxy. This proxy attends external requests and redirects them to the appropriate subsystem which can be:
Several different modules are used to accomplish the different tasks described above. These modules are described more analytically in the following. The paths where individual folders and modules are stored in the system are also provided as an auxiliary tool to the reader.
A set of routines (projects/client/src/) written in python are installed in each client PC. Every time they are executed the client pc is connected to the Eubrewnet server. The local brewer files and all relative information (file size, modification date etc.) are listed and compared to the corresponding information for the files that have been already stored in the server and only the files which are either new or have changed, are transferred from the former to the later, checking md5 checksums (https://en.wikipedia.org/wiki/MD5). Each file transferred to the server is stored in the input directory corresponding to each brewer. Both the client and server programs are implemented in python. Communication between client and server is achieved via the xml-rpc protocol (https://en.wikipedia.org/wiki/XML-RPC).
This module is the basis of the entire project. It is responsible for verifying the validity of each file obtained in the acquisition module and then store the desired information in the database. This module consists by four sub-modules described above. A schematic diagram of this process is shown in Figure 2.
 Figure 2: Schematic diagram of the import Module
The product generation scripts (in: projects/iberonesia3/modules/iberonesia3/) process the data which are stored in the database and generate specific products. They are currently implemented in python. The products currently generated are:
The website can be used by the users to perform several tasks related to the database. There are two versions of the website. In the version which is available to the public it is allowed to check the status of the brewers (e.g. brewer activity and status of the B file of the current day) and get any products they want. In the other version which is for registered users, it is also possible to download files, get reports for possible problems of the instruments or consult/manage checklists and charts to obtain the status of the brewers. The web module is implemented in Python, using web2py as a development framework.
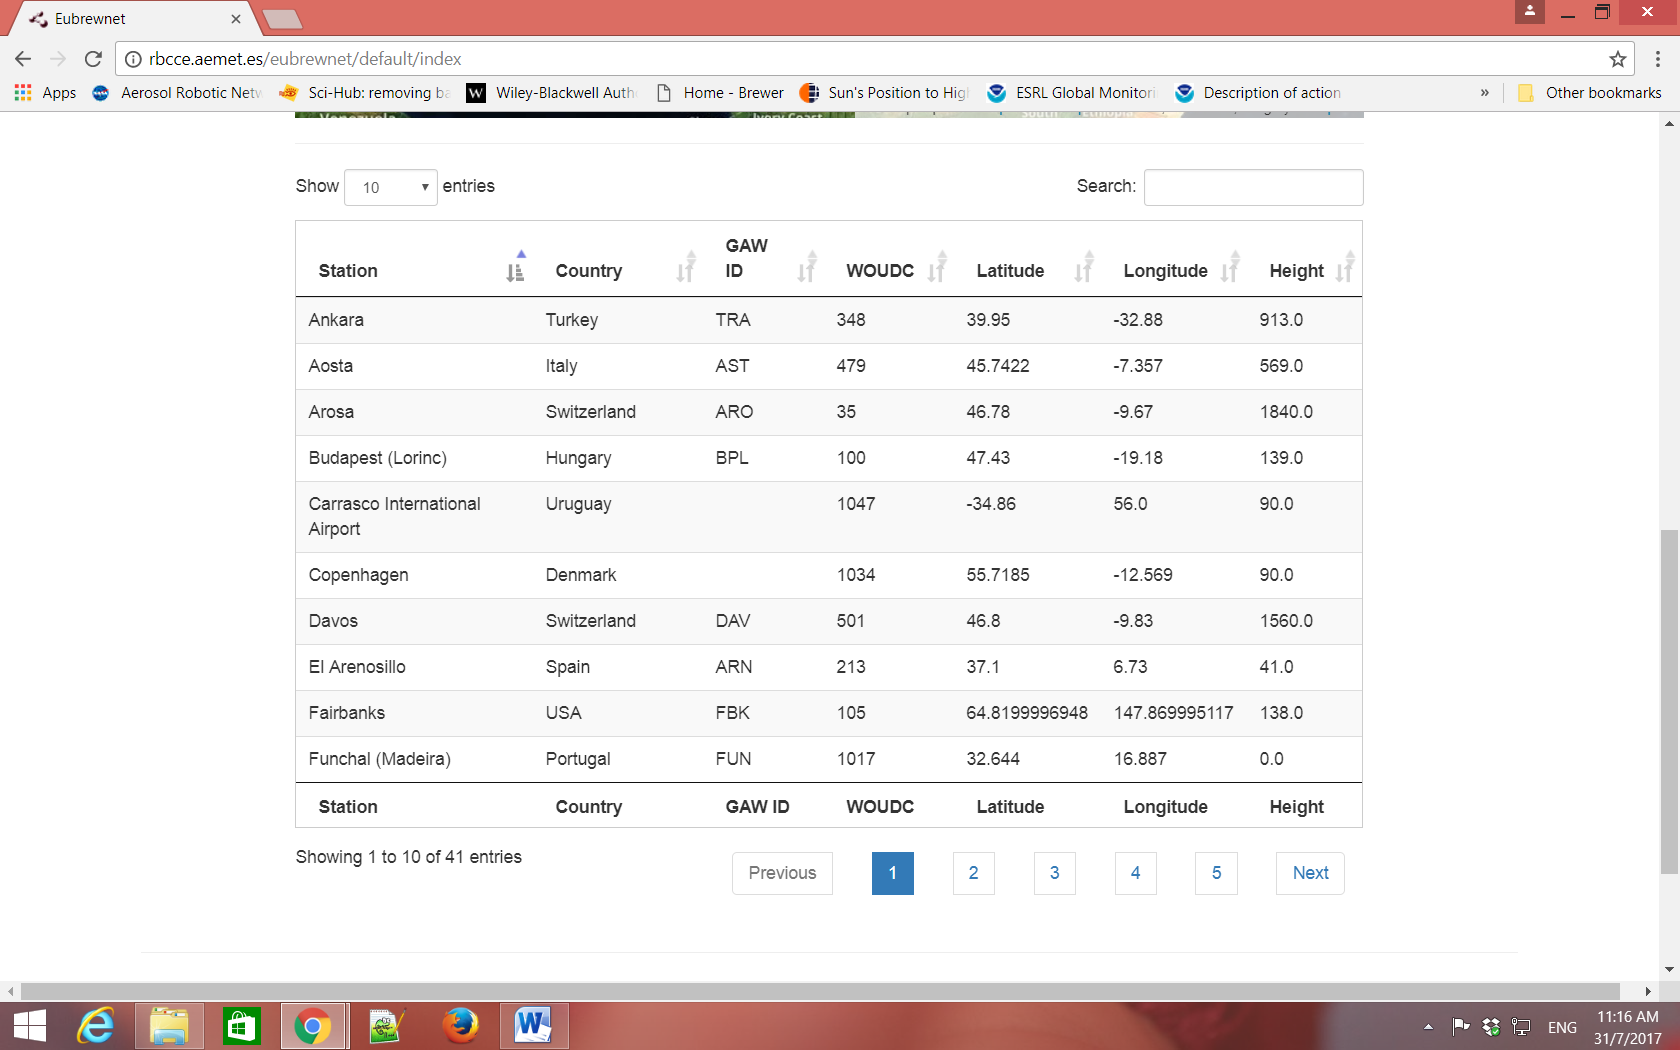
The interface of the Eubrewnet webpage is presented in the following figures. An interactive map shows the stations which provide data by one or more Brewers. The user can choose a station either from the map (Figure 3) or from a list (Figure 4). As already explained, registered users have more options.
Figure 3: The interactive map of the Eubrewnet webpage for (a) non-registered and (b) registered users.
 Figure 4: The list of Brewers.
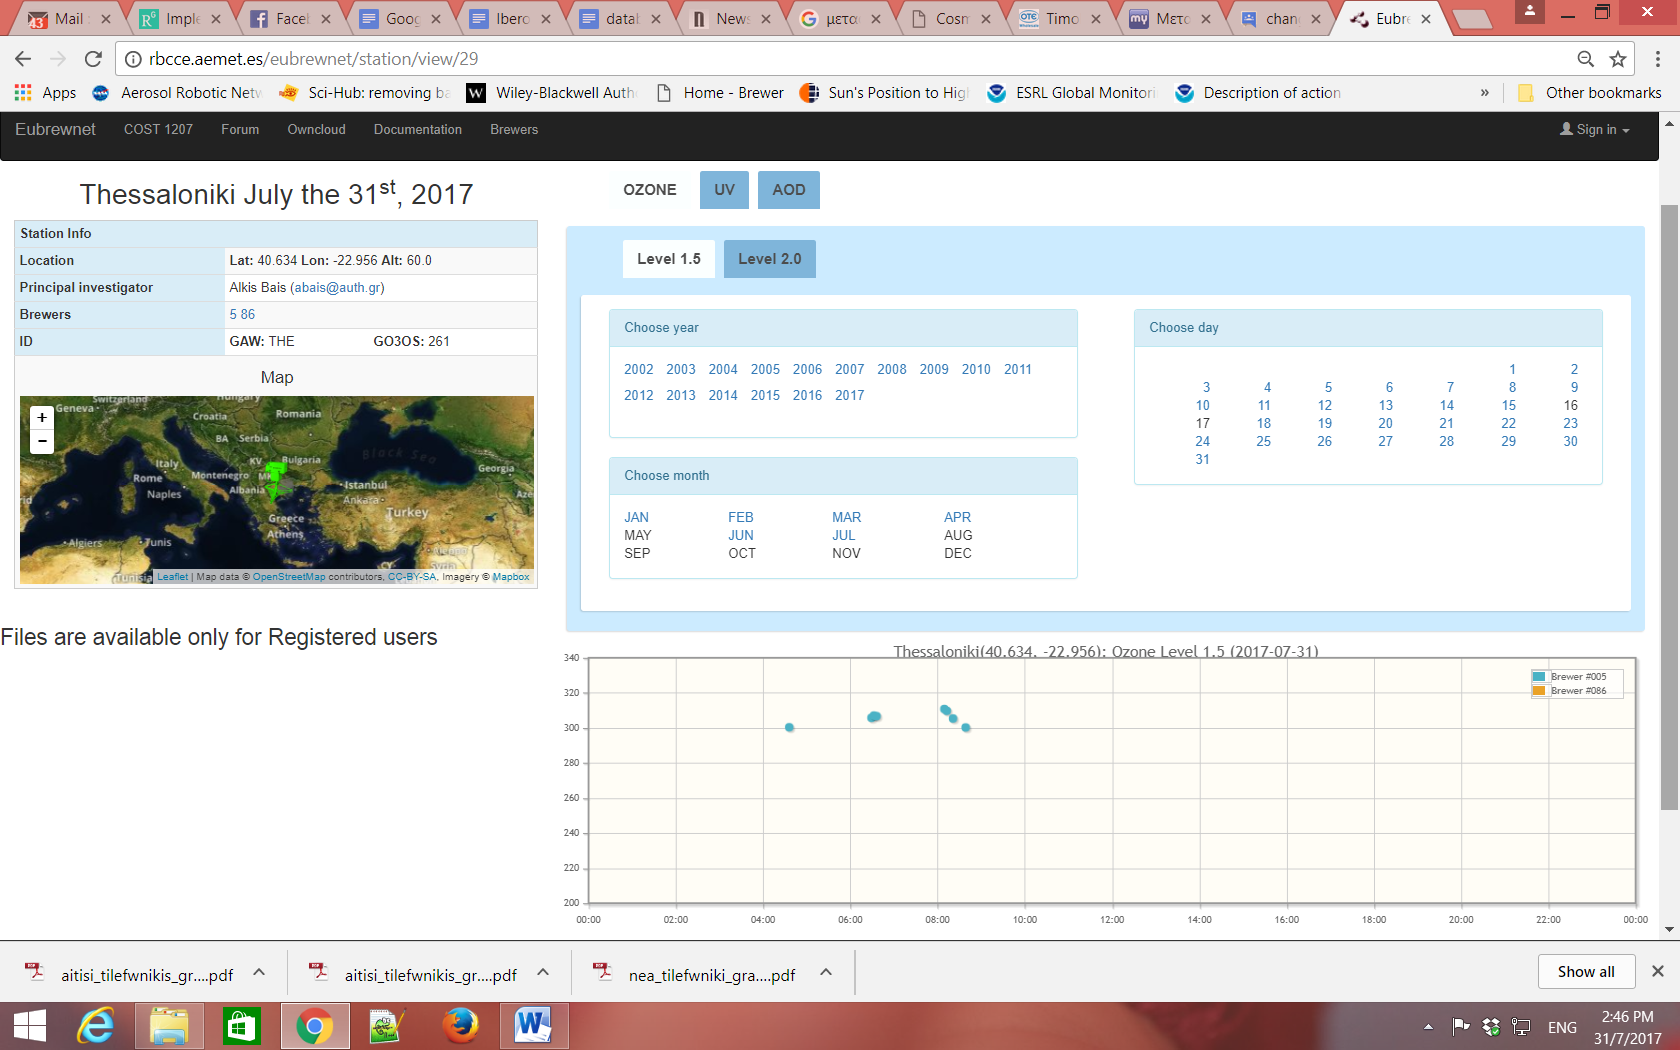
When a station has been selected, then additional options and information appear for the particular station and instruments (Figure 5).
 Figure 5: Information for the Brewer operating at Thessaloniki.
As already discussed, three products are available: TOC, UV and AOD. The generation of the TOC product is already operative while the generation of the UV and AOD products is still under development. There are three different levels of the products (1.0, 1.5 and 2.0). Levels 1.5 and 2.0 are available to the public, while level 1.0 is available only to the registered users. Raw data (which could be described as Level 0) are stored in the database, though graphical information is not available through the web page. Though, registered users can download raw data using proper functions (see Section 5.5). In general, a higher product level means a more reliable product.
There is also an option to have different versions of the same products in the database. This way, a new version of the products can be added after e.g. re-evaluation or slightly different processing of the dataset, without erasing the previous one.
The TOC is calculated by the direct sun (DS) Brewer measurements which have been processed using the standard Brewer algorithm (Kipp & Zonnen 2008). In order to obtain a reliable product with uncertainties within the desirable uncertainty limits, proper calibration and correction constants have to be used for the processing of the DS measurements. These constants are provided by the operator and stored in a proper configuration table. A detailed list of the configuration parameters which have to be declared by the operator can be found at the following link:
http://eubrewnet.aemet.es/dokuwiki/doku.php?id=devel:eubrewnetconfiguration
while an overview of the processes which can be used by the operators to fill the configuration table is provided here:
http://eubrewnet.aemet.es/cost1207/2015/03/04/configuration-upload-intructions/
In the Eubrewenet wiki there is also analytical information regarding the processing (http://eubrewnet.aemet.es/dokuwiki/doku.php?id=codes:ozoneproduct) and the storage (http://eubrewnet.aemet.es/dokuwiki/doku.php?id=codes:productsdescription) of the different levels of the TOC. In the following there is a short description of the four different levels of the TOC product:
The generation of the UV product is still under development. Though, a general description of the products of different levels that will be available is the following:
For the generation of the UV product, the operators should provide the configuration files for:
More information regarding the UV product can be found in Lakkala et al. (2016)
The AOD product is also under development. In this case the processing procedures for the products of different levels are still under discussion. The calculation of the AOD is based on the DS measurements and is performed for the same wavelengths used for the calculation of the AOD (~306, 310, 313, 317 and 320 nm ). The operator has to provide the file of the AOD calibration. More information for the retrieval and the state of development of the AOD product can be found in Solano et al. (2016).
Since the UV and AOD products are under development, it is not yet possible to update the configuration constants for them. Currently the operators are able to provide the configuration constants for the station (location, name of the operator etc.) and the TOC product (calibration constants, temperature coefficients etc.). More detailed information regarding the configuration constants can be found at:
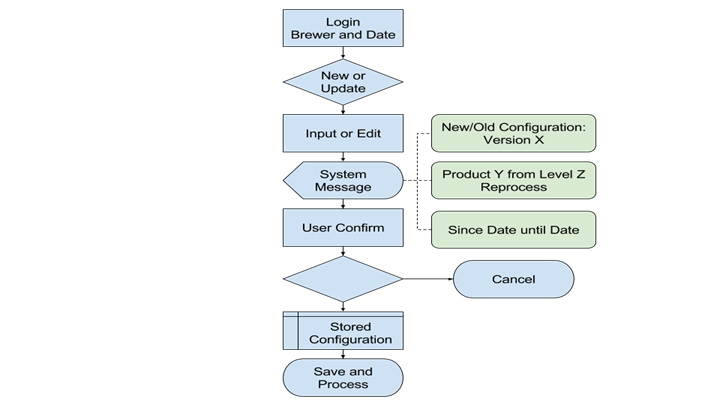
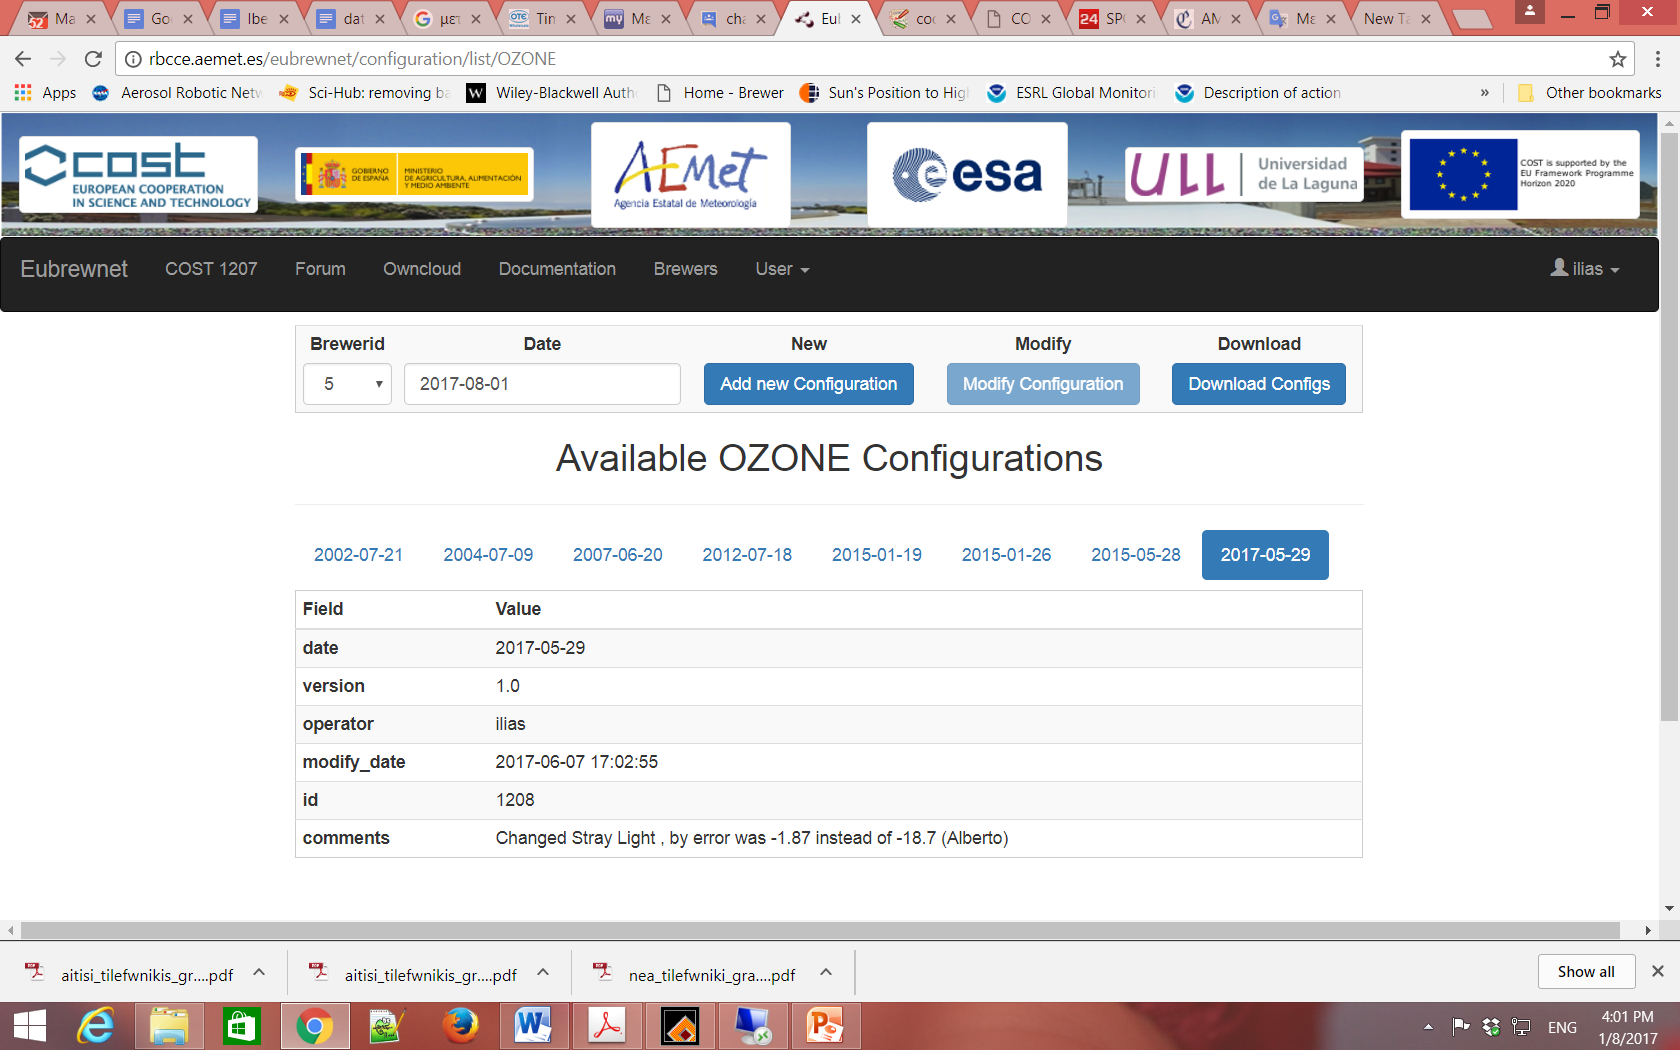
The TOC configuration constants have to be updated after a new calibration of the instrument (usually every ~2 years) or after important changes in its operational characteristics. Occasionally, update of the station configuration constants may be also necessary. Proper tools have been developed and are available to the users so that they can update the configuration constants in an easy way (http://eubrewnet.aemet.es/cost1207/2015/03/04/configuration-upload-intructions/). A flowchart of the TOC configuration change procedure is shown in Figure 6, while in Figure 7 the interface through which the operator can update the TOC configuration constants is presented.
 Figure 6: Generalized flowchart of the TOC configuration change procedure
 Figure 7: Interface of the TOC configuration tool
Different sets of configuration constants correspond to different periods (Figure 7). When a user is logged in, he/she should select whether he/she wants to modify an existing set of configuration constants or to add a new one (for a new period). Then the user can either upload a file with all the needed information or change the information he/she wants by hand. The corresponding tools and procedures for UV and AOD will be more complicated since a larger amount of information has to be provided by the user. More information regarding the configuration versioning can be found in:
http://eubrewnet.aemet.es/cost1207/2015/03/04/configuration-upload-intructions/
A number of functions have been developed, which allow the registered users to directly get the information stored in the database (i.e. products of different levels, raw data, results from diagnostic tests etc). These functions are written in python and are included in the module getdata.py (projects/iberonesia3/modules/iberonesia3/getdata.py). The root to all access functions is the same: http://eubrewnet.aemet.es/eubrewnet/data/. From this point, users can select the proper function and get the data they need . The functions provide four different ways of accessing data using one of the format input parameters, described in Table 1:
Table 1: Possible ways of accessing the Eubrewnet data using access functions and links for examples for the Get DS function.
| Format input | Description | Example |
| jsonM | JSON matrix formed by lists of lists (default value). The first list is formed by the parameters’ names and the following lists are the query outputs | Get DS by default |
| jsonO | JSON object of lists, where each key is the parameter name and its value is the time sorted list of them | Get DS with jsonO format |
| text | Human readable, comma separated values where first row is the parameters’ names and the following are the query outputs | Get DS with text format |
| csv | CSV direct download where in first row are the parameters’ names and the following are the query outputs | Get DS with text format |
Almost all functions can receive the inputs listed in Table 2:
Table 2: Inputs of the access functions and links for examples for the Get DS function.
| Parameter | Description | Example |
| brewerid | Brewer identification number | Get function with brewerid input parameter |
| date | Date in YYYY-MM-DD format | Get function with date input parameter |
| enddate | Date in YYYY-MM-DD format. If provided, the function will return the query in a date range | Get function with enddate input parameter |
More analytical information regarding the access functions can be found in:
http://eubrewnet.aemet.es/dokuwiki/doku.php?id=codes:dbaccess
A library for Brewer data processing has been developed using Python and has been integrated in the Eubrewnet database. The standard algorithm for Brewer data processing is based on the version 4.1 of the brewer software (http://www.o3soft.eu/), written in GWBASIC, and the Brewer MkIII - Operator's Manual (Kipp & Zonen, 2008), available through the Kipp & Zonen web page (http://www.kippzonen.com). Analytical documentation for the library, including instructions for its implementation and usage is published on the EUBREWNET documentation page:
http://eubrewnet.aemet.es/dokuwiki/doku.php?id=devel:brewerpythonmodule
The last version of the brewer python module is available at the following link:
http://rbcce.aemet.es/svn/python/libbrewer/
Although the Brewer module provide functions to analyse data, it doesn’t provide any function to retrieve the data. For this purpose, another python module which downloads data from the EUBREWNET DB is developed:
The Brewer diagnostic tool has been created to assist the Quality Control and Quality Assurance (QA/QC) of the measurements stored in the Eubrewnet database. The main component of this tool is a parser which extracts information regarding possible errors from the B and D files received from the system and stores it in status files and the database. Up to today, the error detection is based on the error messages contained in the B and D files. Most types of error messages written in these files (48 different error messages) can be detected. However, there are features of the diagnostic tool that are still under development. In the future the detection of errors will be also based on a range of acceptable values for each type of Brewer measurements. Depending on the type of measurements, proper thresholds will be specified, above or below which the measurement will be considered problematic. It is also planned to include more error messages that can be detected in the B and D files.
The B and D files are processed three minutes after their receival. Given that files are received every 15 minutes, the detection of errors is performed in almost real time. As soon as an error is detected, the color of the corresponding instrument shown in the Eubrewnet Interface (for registered users) changes depending on the type of error. More specifically, the different colors used to describe the state of each Brewer are the following:
When the user clicks on a brewer, then he is redirected to a page with details regarding the state of the specific instrument, where a list of the original error messages from the D or B files are also included. More details regarding the Brewer diagnostic tool can be found to the following link:
http://eubrewnet.aemet.es/dokuwiki/doku.php?id=codes:brewerdiagnostictool
Antón, M., Serrano, A., Cancillo, M. L., Vilaplana, J., Cachorro, V. E., and Gröbner, J.: Correction of Angular Response Error in Brewer UV Irradiance Measurements, Journal of Atmospheric and Oceanic Technology, 25, 2018-2027, 2008.
Bais, A. F., Kazadzis, S., Balis, D., Zerefos, C. S., and Blumthaler, M.: Correcting global solar ultraviolet spectra recorded by a Brewer spectroradiometer for its angular response error, Appl. Opt., 37, 6339-6344, 1998.
Berjon, A. and Redondas, A.: Effects of temperature on Brewer TOC measurements, in preparation for submission to AMT, 2017.
Brewer, A. W.: A replacement for the Dobson spectrophotometer?, PAGEOPH, 106-108, 919-927, 1973.
Fountoulakis, I., Redondas, A., Lakkala, K., Berjon, A., Bais, A. F., Doppler, L., Feister, U., Heikkila, A., Karppinen, T., Karhu, J. M., Koskela, T., Garane, K., Fragkos, K., and Savastiouk, V.: Temperature dependence of the Brewer global UV measurements, Atmos. Meas. Tech. Discuss., https://doi.org/10.5194/amt-2017-171, in review, 2017.
Karppinen, T., Redondas, A., García, R. D., Lakkala, K., McElroy, C. T., and Kyrö, E.: Compensating for the Effects of Stray Light in Single-Monochromator Brewer Spectrophotometer Ozone Retrieval, Atmosphere-Ocean, doi: 10.1080/07055900.2013.871499, 2014. 1-8, 2014.
Kipp & Zonen: Brewer MKIII Spectrophotometer Operators Manual. Kipp & Zonen Inc., 2008.
Lakkala K., S.F. León-Luis, A. Redondas, B. Hermández, T. Karppinen, A. Arola: UV Configuration and Processing in the EUBREWNET, COST ES1207, Brewer Ozone Spectrophotometer/Metrology Open Workshop, Azores, Portugal, May 17-20, 2016
López-Solano J., Carlund T., Hernández-Cruz B., León-Luis S.F., Carreño V., Berjón A., Santana-Díaz D., Bais A.F., Moreta J.R., Shirotov V., Rimmer J., Vilaplana J.M., Wilson K.M., Gröbner J., Boulkelia L., Eriksen P., Karppinen T., Diémoz H., Rodríguez Valido M., Redondas A.: “Aerosol optical depth in the ultraviolet range: a new product in EUBREWNET”, Quadrennial Ozone Symposium 2016 (QOS 2016), Edinburg, UK, 4 - 9 September, 2016
Slaper, H., Reinen, H. A. J. M., Blumthaler, M., Huber, M., and Kuik, F.: Comparing ground-level spectrally resolved solar UV measurements using various instruments: A technique resolving effects of wavelength shift and slit width, Geophysical Research Letters, 22, 2721-2724, 1995.